The Hemiblocks
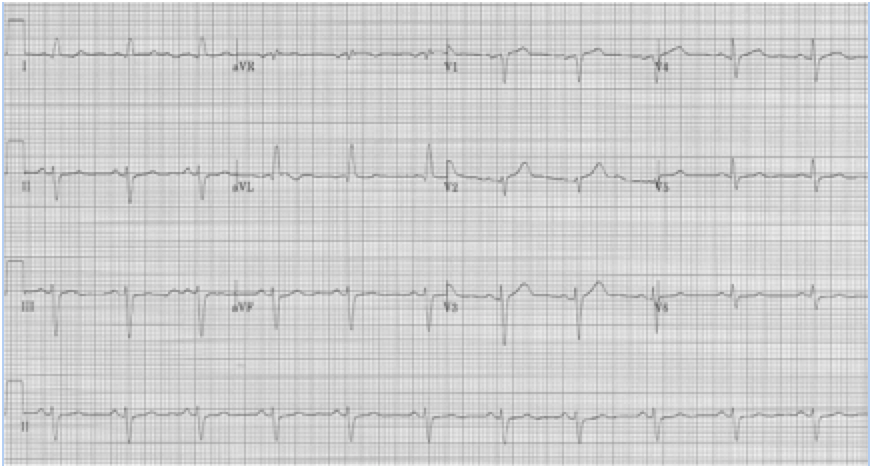
The hemiblocks (left anterior and left posterior) have little interest or utility in the interpretation of an acute 12-lead EKG. When coupled with a RBBB they are more significant because of the resulting bifascicular block. However, in the interest of complete coverage of EKG interpretation…
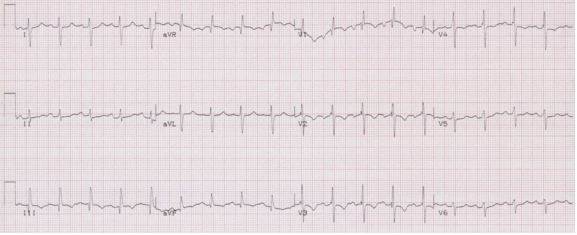
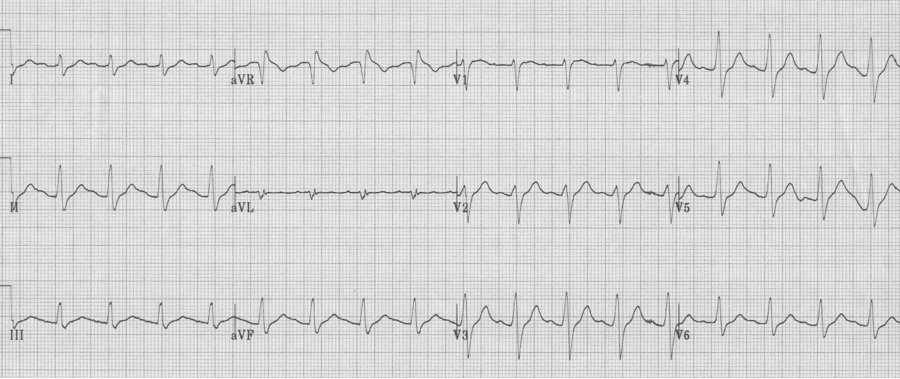
Left anterior hemiblock
• Small Q in leads I and aVL and small R in leads III and aVF
• Prominent R in I and aVL and deep S in III and aVF
• Left axis deviation (between -30° and -90°)
• QRS slightly prolonged at <110ms
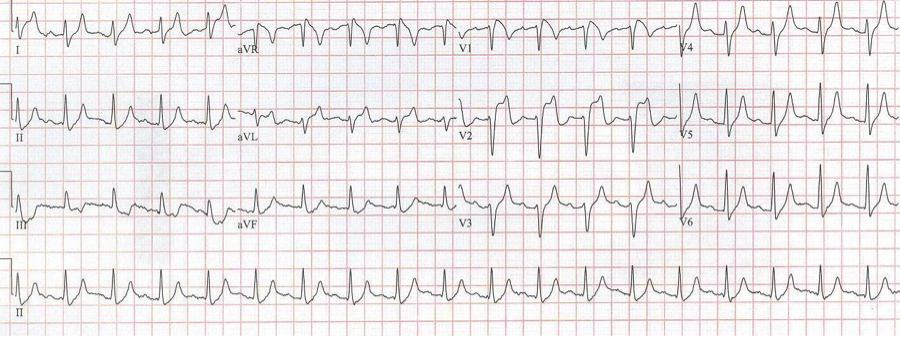
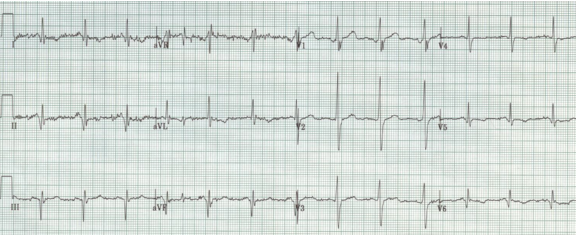
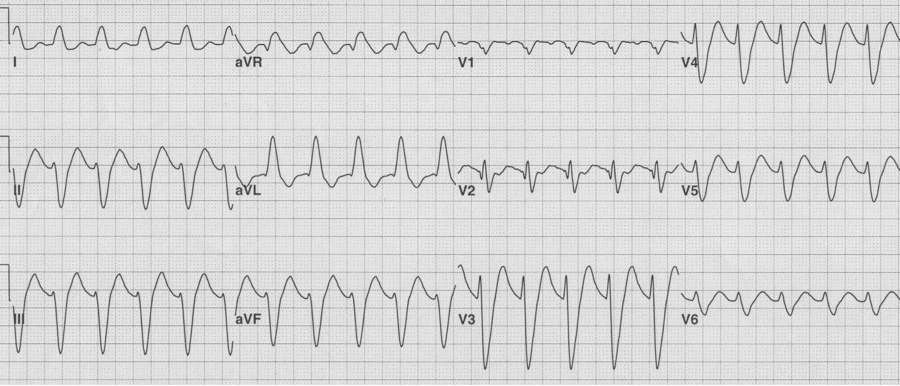
Left posterior hemiblock
• Small Q in leads III and aVF, and small R in I and aVL
• Prominent R in III and aVF and deep S in I and aVL
• Right axis deviation
• QRS slightly prolonged
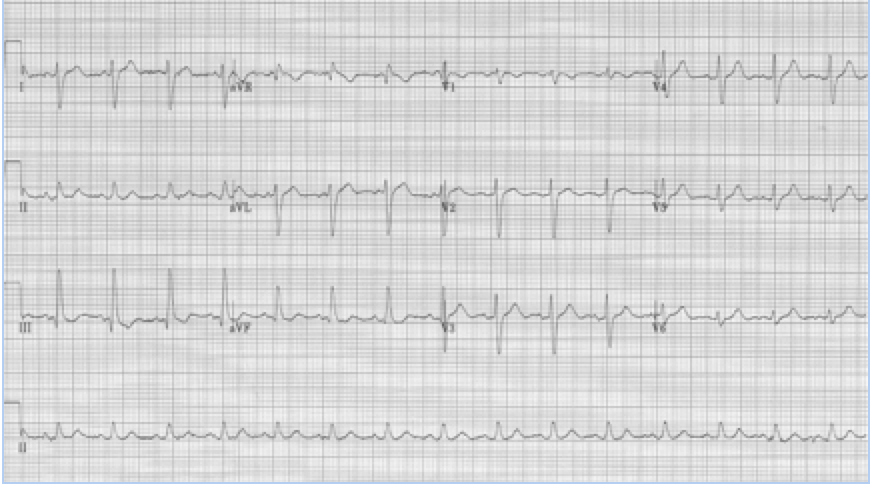
Left posterior hemiblock (LPH)
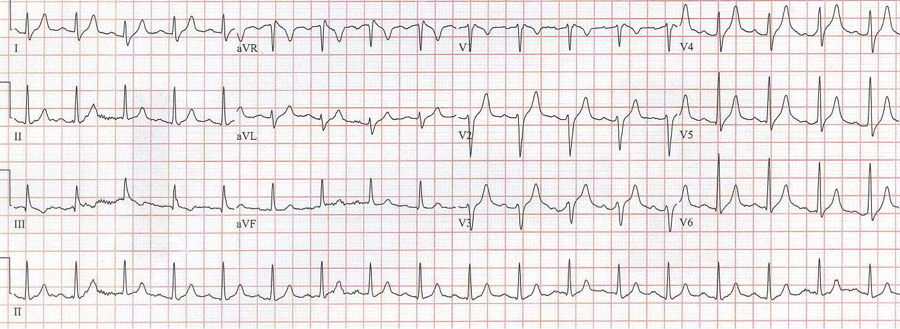
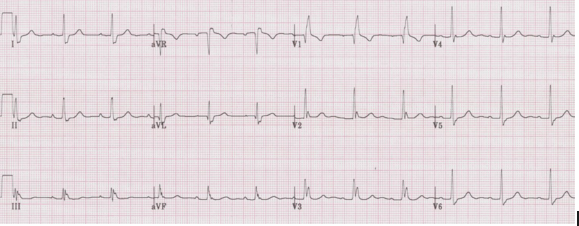
When a hemiblock occurs with a RBBB it is identified primarily by axis deviation, a finding not part of the EKG criteria for RBBB. RBBB with a hemiblock becomes a bifascicular block.
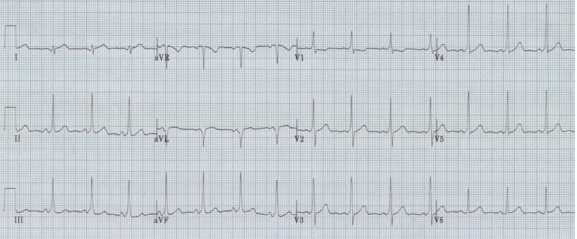
• RBBB with left axis deviation adds left anterior hemiblock
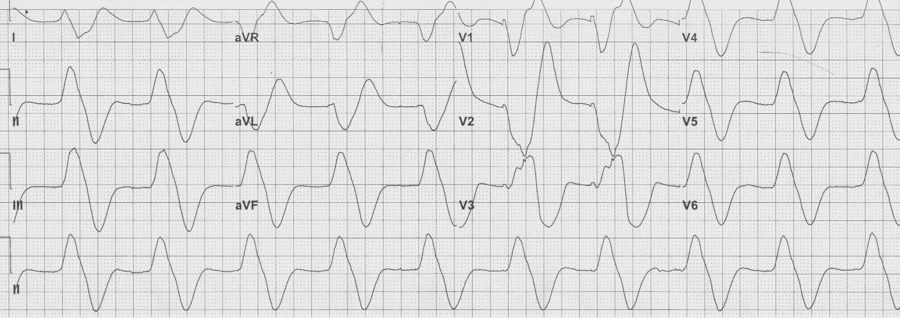
• RBBB with right axis deviation adds left posterior hemiblock
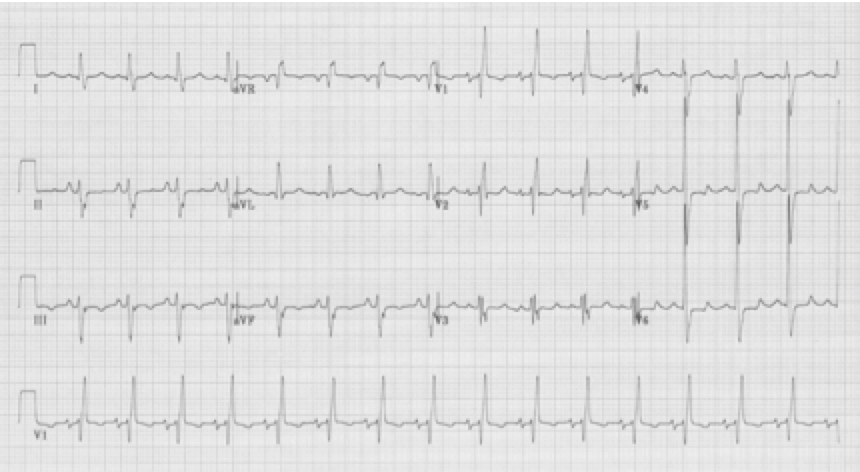
RBBB with left anterior hemiblock due to left axis deviation (-60°)
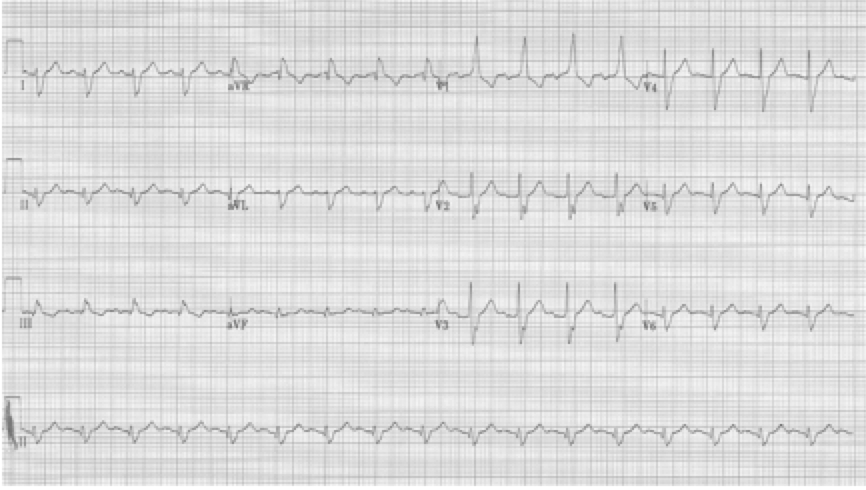
RBBB with left posterior hemiblock due to right axis deviation
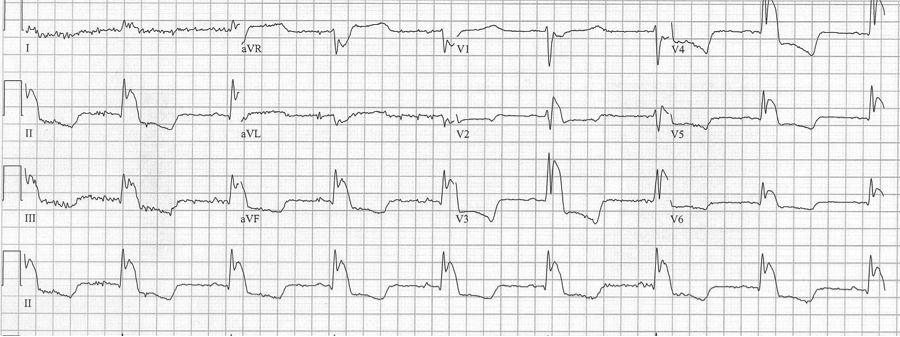
The implication of a LBBB in ACS is evolving. While a new, or presumed new, LBBB with chest pain has long been considered an indication for acute intervention, it has recently been removed as an indication for PCI or thrombolysis from several guidelines including those of the American Heart Association. Several studies demonstrate that LBBB is rarely associated with an acute MI, and the much-maligned Sgarbossa criteria have gained new legitimacy in the evaluation of ACS. This EKG is a perfect example of LBBB and the striking repolarization changes that are expected. The criteria for diagnosis of LBBB include QRS >120msec and a monophasic R wave in lead V6 (that is, absence of septal Q waves in the lateral leads). The widespread and expected repolarization changes include ST-segment depression and T-wave inversion in the lateral leads with ST-segment elevation in the anterior leads. Notice that expected repolarization changes (ST-segment and T-wave) are discordant (opposite) to the direction of the QRS complexes. Memorize this pattern, or understand its origin, because deviation from the expected may be a cause for concern. Interpretation of acute ST-segment and T-wave changes due to ischemia and infarction is difficult, if not impossible, with a LBBB and the associated repolarization changes. Historically a new, or presumed new, LBBB with chest pain concerning for ischemia was a criteria for acute intervention (thrombolysis or acute PCI). This recommendation was based on early fibrinolytic trials with the final diagnosis of MI based on cardiac enzymes. Once these patients began to be referred for interventional catheterization it became clear that the majority of LBBB with chest pain presentation were not predictive of acute MI, but were instead a pre-existing marker of structural heart disease (hypertensive cardiomyopathy, prior MI, or valvular disease). It is also clear that a new LBBB associated with acute infarction implies a very large infarct territory, and is typically associated with cardiogenic shock or acute pulmonary edema, and high mortality. Sgarbossa published an analysis from the GUSTO-1 trial evaluating EKG criteria that indicated acute infarction presenting with LBBB. She found 3 criteria that were useful: These criteria were reported to have low sensitivity but high specificity, and essentially recommended as superfluous to using clinical suspicion with a new, or presumed new, LBBB. This EKG is a LBBB, though barely meeting QRS widening criteria – note the concordant ST-depression in the anterior leads. However, as previously claimed, it actually seems that the occurrence of a new LBBB associated with acute MI is actually relatively low. Studies that have looked at the predictive value of a new, or presumed new, LBBB with concerning chest pain, find that an angiographic culprit lesion associated with Sgarbossa’s criteria is sensitive and specific, at least for the first two criteria. The third criteria of discordant ST-segment elevation ≥ 5mm continued to have disappointingly low predictive value. Modified Sgarbossa criteria have been recommended by Dr. Stephen Smith of Hennepin County Medical Center and subsequently validated by Myers. Smith’s modification involves criteria #3, and he finds that it is not an absolute height of discordant ST-segment elevation, but a proportional amount compared to the amplitude of the associated QRS. The discordant ST-segment elevation (typically seen in V1-3) should never be more than 25% of the associated S wave. Management algorithm for patient with suspected MI and LBBB Cai, Sgarbossa, et al. Am Heart J 2013 References Cai Q, Mehta N, Sgarbossa E, et al. The left bundle-branch block puzzle in the 2013 ST-elevation MI guideline: From falsely declaring emergency to denying reperfusion in a high-risk population. Are the Sgarbossa Criteria ready for prime time? Am Heart J 166:409-13, 2013. Meyers HP, et al. Validation of the modified Sgarbossa criteria for acute coronary occlusion in the setting of LBBB: a retrospective case-control study. Am Heart J 170:1255-64, 2015. Neeland I, Kontos, M, de Lemos, J. Evolving considerations in the management of patients with LBBB and suspected MI. J Am Coll Cardiol 60:96-105, 2012. Kumar V, et al. Implications of LBBB in patient treatment. Am J Cardiol 111:291-300, 2013. Smith SW, et al. Diagnosis of ST-elevation <I in the presence of LBBB with the ST-elevation to S wave ratio in a modified Sgarbossa rule. Ann Emerg Med 60:766-76, 2012.

An ex-resident, Dr. Matt Hinderaker, and his colleague Dr. Bill Swiler, from Lakeview Hospital in Bountiful, Utah, forwarded a good example of a fairly common rhythm dilemma. A middle-aged woman presented with tachycardia. What’s the rhythm and how should one proceed. I teach that the flutter rate in atrial flutter should be between 250-300/minute yielding a classic presentation of 2:1 flutter with ventricular rates between 125-150/min. The more normal the heart, the closer to 150/min the rate will be. The P waves in atrial tachycardia are typically discrete, not the saw-tooth or picket fence appearance of flutter waves that generally appear connected, especially in the inferior leads. I include examples of slow flutter below.
EKG #1. A regular narrow-complex tachycardia at 170/minute. At this rate the differential includes SVT, sinus tachycardia, or an ectopic atrial tachycardia. This rate is too fast for 2:1 atrial flutter as flutter waves should occur between 250-300/minute, with 2:1 flutter at 125-150/minute.
A close-up of leads III and aVF does seem to include variation from the baseline that is reminiscent of a flutter wave however. Given the diagnostic uncertainty it was reasonable of the providers to attempt a trial of adenosine (Adenocard®).
A rhythm strip demonstrates discrete P waves at a rate of 170/minute. Soon after the trial of adenosine, the rhythm reverted to regular QRS complexes at 170/minute.
After diltiazem the P waves at 170/minute are obvious with 2:1 AV block giving a ventricular rate of 85/minute. The diagnosis is atrial tachycardia now with 2:1 block, but initially presenting with 1:1 block.
1a – Narrow-complex tachycardia at 145/minute

1b – increased AV blocking after diltiazem with 4:1 and 2:1 blocking
3 – slow 2:1 flutter at 110/minute
4 –flutter waves can appear unusual, here deeper in the inferior leads

– lead II rhythm strip

– after therapy, atrial flutter with 4:1 AV block
5 – This 12-lead was interpreted by the computer algorithm as an inferior STEMI.

– closeup of leads II and aVF from above EKG

– after Rx with diltiazem, apparent “STEMI” was caused by a portion of flutter wave
Lead aVR is much under appreciated by many who interpret EKGs many times each shift. Some have even suggested that we should routinely record only an 11-lead EKG. A review of the literature finds multiple examples of clinical utility of lead aVR, including:
1. Identifying limb lead misplacement
2. Dextrocardia
3. Identifying critical lesions in ACS
4. TCA toxicity
5. Pericarditis
6. Differentiating mechanism of re-entry SVT
7. As well as other adjuncts to other important EKG criteria…see below
Identifying lead misplacement will save many embarrassing situations, and differentiating it from dextrocardia is equally important.

1. Note right axis deviation (deep negative in lead I), and a lead aVR that includes all upright complexes – this represents an extremely unusual combination – best explained by switching of limb leads. It is important and appropriate to kindly ask an EKG technician to re-do the EKG with attention to lead placement.

Same patient with limb leads corrected

2. Another patient with extreme right axis (negative in lead I) and inappropriate upright complexes in aVR, but in this case what is going on with the chest leads? There is no appropriate R wave progression in the chest leads (because the heart lies in the right chest). This is dextrocardia, with reversal of limb leads AND inappropriate chest leads. To improve interpretation of ischemia and infarction, it is advisable to reverse chest leads to the right-sided array.
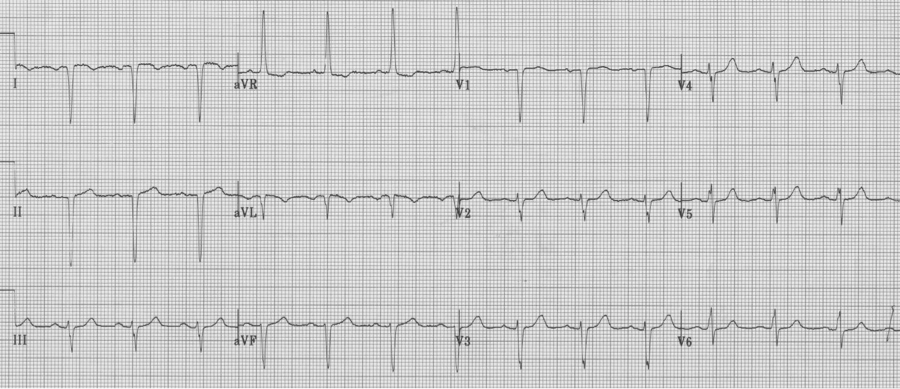
Same patient with chest leads placed in right-sided array (now appropriate to assess the left ventricle).
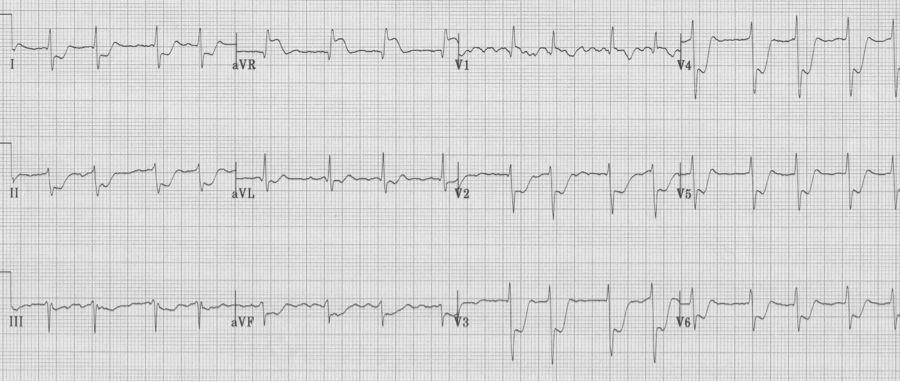
3. Another important change in lead aVR is ST-elevation. While there is some controversy regarding the importance of ST-elevation in aVR with other non-specific changes, one situation worthy of mention is ST-elevation in aVR associated with ST-segment depression in ≥ 8 leads, suggestive of critical left main artery occlusion.
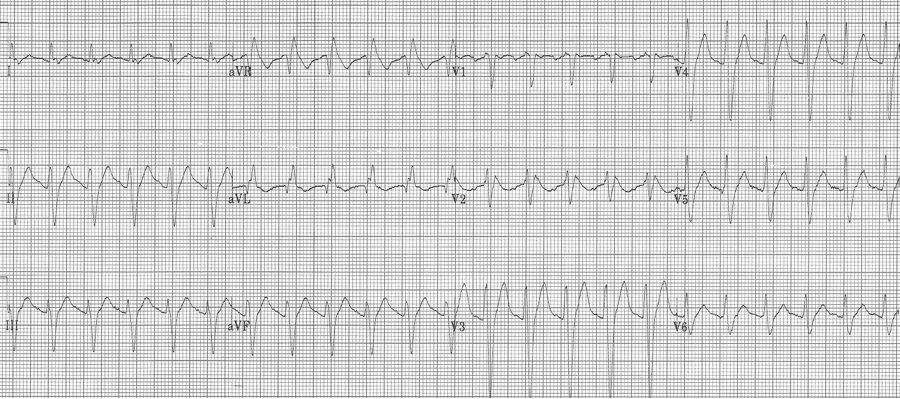
4. This EKG has an upright R in aVR of 5mm – a sensitive sign of TCA (or other Na+ channel blocker) toxicity. This is especially true when associated other signs of Na+ channel toxicity, including tachycardia, QRS prolongation and QT prolongation.
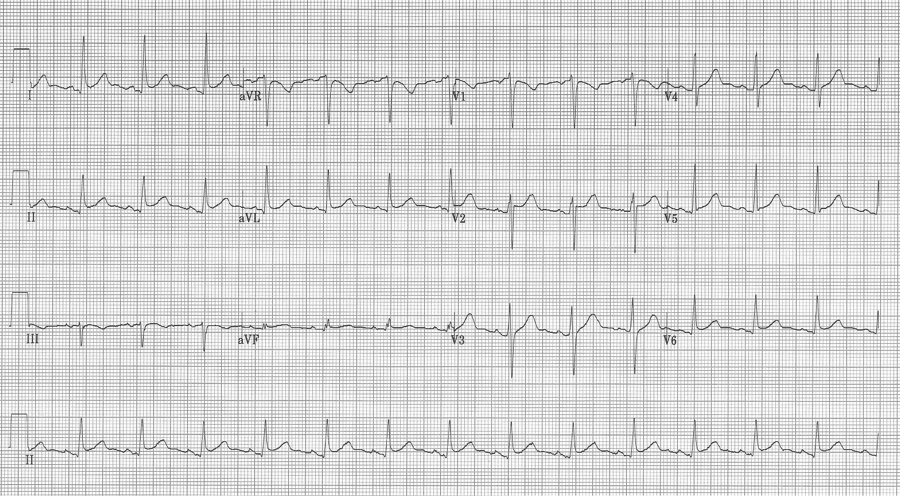
5. This middle-aged man had pericarditis diagnosed by clinical presentation and classic EKG findings – subtle diffuse ST-segment elevation, PR-segment depression in II with PR-segment elevation in aVR, as well as Spodick’s sign (down sloping T-P segment best seen here in the lead II rhythm strip).
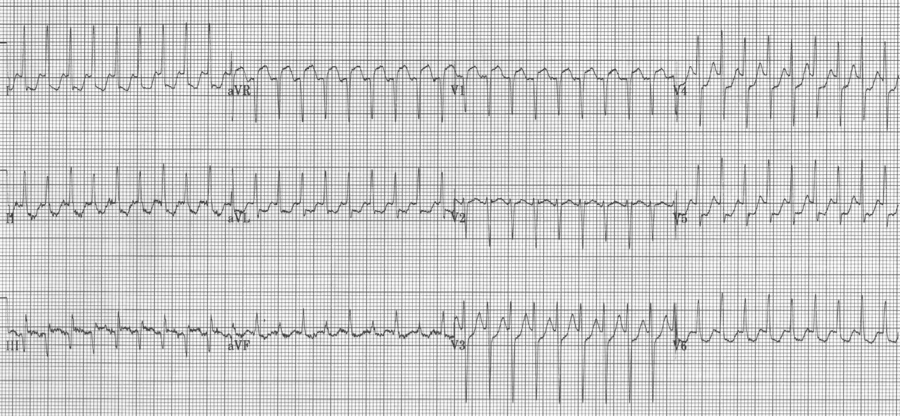
6. SVT with ST-segment elevation in lead aVR is most likely to be AVNRT (AV node reentry tachycardia).
References
Ho YL Am J Cardiol 94:1424, 2003.
Kireyev D, et al. Clinical utility of aVR – the neglected electrocardiographic lead. Ann Noninvas Electrocard 15:175, 2010.
Liebelt EL, et al. ECG lead aVR versus QRS interval in predicting seizures and arrhythmias in acute tricyclic antidepressant toxicity. Ann Emerg Med 26:195, 1995.
Spodick DH. Diagnostic electrocardiographic sequences in acute pericarditis – significance of PR segment. Circ 48:575, 1973.
Perez Riera AR, et al. Clinical value of lead aVR. Ann Noninvas Electrocard 16:295, 2011.
Vereckei A, et al. New algorithm using only lead aVR for differential diagnosis od wide QRS complex tachycardia. Heart Rhythm 5:89-98, 2008.
Williamson K, et al. Electrocardiographic applications of lead aVR. Am J Emerg Med 24:864, 2006.
A 20-year- old man presents to the Emergency Department with palpitations. He is otherwise asymptomatic. VS in triage are BP 128/88, HR 180, resp 18, O2sat 98% on room air, T 37°. Physical exam is unremarkable. An initial EKG is obtained:

Initial EKG – Rapid regular wide-complex tachycardia at 180/min, axis -60° (left axis deviation), QRS wide at 120msec, RBBB morphology (tall R in V1 and wide terminal S wave in V6) – consistent with bifascicular block (RBBB and L ant fascicular block)
This presentation and EKG is typical for Fascicular Ventricular Tachycardia, an infrequent and fairly benign WCT caused by a focus in one of the fascicles. This arrhythmia occurs in individuals without ischemic or structural heart disease. It typically occurs in healthy, young people who present with palpitations without other significant symptoms.
The characteristic EKG findings are essentially diagnostic. Left posterior fascicular VT, occurring in up to 90% of cases, has a RBBB with left axis deviation (consistent with left anterior fascicular block). In 10% of cases fascicular VT arises from the left anterior fascicule and has RBBB morphology with right-axis deviation due to the left posterior fascicular block.
Fascicular block is thought to involve a re-entry circuit involving the Purkinje system triggered by a slow pathway with verapamil sensitivity. And thus the final unique aspect of this arrhythmia is that it is effectively terminated by verapamil. Adenosine, lidocaine and β-blockers are ineffective. Care must be taken with older patients, or unstable patients, because calcium-channel agents may cause hemodynamic deterioration in ventricular tachycardia related to ischemic heart disease and structural heart disease.
Cardioversion occurred following administration of IV verapamil.

The EKG in sinus rhythm also shows some characteristic findings – the left anterior fascicular block (LAFB) remains with T wave inversion in the inferior-lateral leads.

Another young man with palpitations – RBBB with left axis, a LAFB – fascicular VT
References
Canan T, et al. A complex rhythm treated simply: fascicular ventricular tachycardia. Am J Med 127:601-604, 2014.
Elswick BD, Niemann JT. Fascicular ventricular tachycardia: an uncommon but distinctive form of ventricular tachycardia. Ann Emerg Med 31:406-409, 1998.
Ashman phenomenon describes a situation during rapid irregular rhythms (typically atrial fibrillation, but also MAT) when aberrantly conducted beats can appear to be ventricular in origin. The repolarization interval for any QRS (electrocardiographically, the QT interval) is proportional to the R-R interval that precedes it. Therefore, with a long R-R interval followed by a short R-R interval, the complex ending the short interval may find a portion of the conducting system not yet fully repolarized. The portion of the conduction system that is predictably slowest to repolarize is the right bundle and therefore Ashman’s beats will have RBBB morphology. RBBB morphology includes a tall R in V1 and wide terminal S waves in lateral leads.
Nothing is 100% certain, but if a wide complex beat with RBBB morphology ends a short R-R following a long R-R, that wide beat is most likely an aberrantly conducted supraventricular beat. And if subsequent beats are also at a rapid rate they will continue to conduct aberrantly, appearing as couplets or runs of wide-complex tachycardia.
Some examples:
25-year-old man presents with palpitations after an evening of partying, including the use of cocaine. The rhythm is atrial fibrillation with a rapid ventricular response. The wide beats could be concerning if interpreted as frequent PVCs in a young man after cocaine use…however, Ashman’s phenomenon predicts that all of these wide beats are supraventricular in origin. This is a V1 rhythm strip with tall R wave – thus RBBB morphology of the wide beats.

Rapid a fib with Ashman beats (note long-short-wide beat sequences)
78-year-old man is being observed after a presentation with chest pain. Nursing is concerned by a “three beat run” of wide complexes. “Isn’t this ventricular tach?” they ask. Fortunately you could explain that the wide beats are aberrantly conducted supraventricular beats as predicted by Ashman’s phenomenon.

Rapid a fib with “3 beat run” of wide beats, a beautiful example of Ashman’s

MAT with several Ashman beats (incomplete RBBB during “normal” conduction with wider aberrantly conducted Ashman beats)

V1 rhythm strip, also MAT with Ashman beats
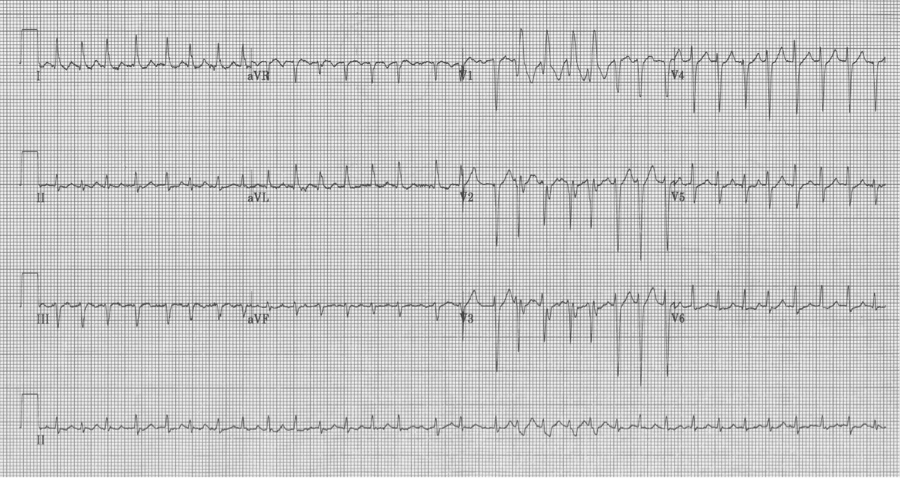
Ashman beats with RBBB in V1 – sometimes a 12-lead EKG is helpful
50-year-old man presents to the ED with significant alcohol withdrawal symptoms including palpitations. EKG reveals atrial fibrillation with rapid ventricular response at 200/minute with 4 wide-complex beats (best seen early in lead aVR). These beats do follow Ashman’s prediction for aberrancy but since the beats do not occur in lead V1 noticing the RBBB morphology is a little more challenging…the wide terminal S wave in lead aVL is consistent with classic RBBB criteria.
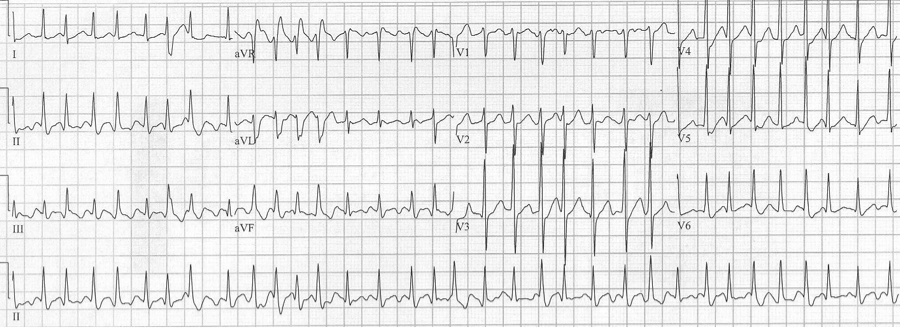
A fib with RVR and 4 Ashman beats in leads aVR, aVL and aVF
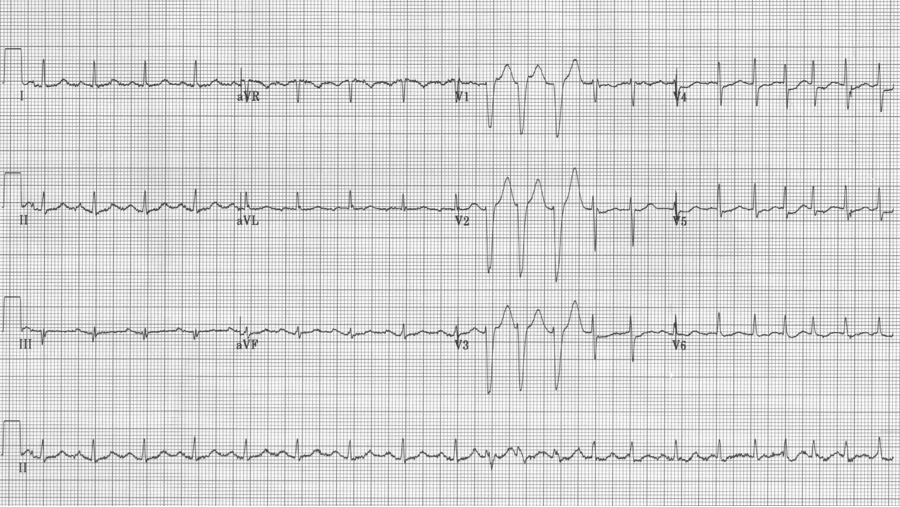
At first glance the wide beats in V1 might suggest Ashman’s phenomenon, but this is not an irregularly irregular rhythm, and the morphology of the beats is not consistent with RBBB morphology. These beats are ventricular in origin.
A 41-year-old heroin user presented to the ED with agitation and back pain. An ECG early in his course was concerning for STEMI and the interventional cath team was alerted.
His labs returned with a non-hemolyzed potassium of 7.8! Other pertinent labs included BUN 27 and creatinine 3.6 (8/1.1 one month earlier) and CPK 28,960. Needless to say, once these labs returned, cardiology signed off on the case. He was hyperkalemic and had ATN from rhabdomyolysis.
The hyperkalemia was aggressively treated and the following ECG was obtained 90 minutes later.
Look closely at the apparent ST-segment elevation in leads V1-2 on the initial ECG. Do these changes look like anything else you may have seen? I thought they looked similar to changes of Brugada syndrome…
There have been multiple case-reports of hyperkalemia presenting with ECG changes typical of Brugada pattern. Perhaps Littmann, who reported 9 patients from his practice over 10 years, and also reviewed an additional 15 cases from the literature, published the best series. In most ECGs of hyperkalemic Brugada changes, the typical signs of Brugada (coved ST segments in V1-2) are superimposed on changes of hyperkalemia, such as QRS widening, axis shifts, or flattening or absence of P waves. But in some cases, the Brugada changes were the only sign of hyperkalemia.
Junttila, who works with the Brugada brothers, reported a series of 47 patients who presented with Brugada-type ECG changes induced by one of several factors known to “unmask” Brugada syndrome. These factors included Na-channel blocking medications, propofol, cocaine, TCA, hyperkalemia, and fever. Of the 47 patients reported, 24 (51%) developed malignant arrhythmias during the acute event., including 18 with sudden cardiac death. The author concludes that the presence of a Brugada-type ECG pattern in patients during an acute event such as fever, treatment with several medications, drug use or electrolyte abnormality should be considered a risk factor for the development of life-threatening arrhythmias.
Some patients with inducible Brugada changes have been shown to have a genetic mutation of the Na-channel as in classic Brugada syndrome. Many factors, which are associated with unmasking Brugada, involve either reduction in inward sodium current (Na-channel blocking agents, TCA, cocaine) or augmenting outward sodium current (hyperkalemia). Mutated sodium channels have been shown to exhibit temperature-dependent gating changes and thus more evident ECG changes at increased temperatures.
It is difficult to make clinical recommendations regarding this phenomenon, but it is important, I believe, to be familiar with the occurrence of transient Brugada pattern during acute medical conditions that do find their way to the emergency department. When these changes are noted, think of hyperkalemia, treat the fever or stop the potential offending medication, and I would suggest monitoring the patient’s rhythm closely. And no, not everyone with a fever needs an ECG!
Sources
Junttila MJ, Gonzalez M…Brugada, Brugada, Brugada. Induced Brugada-type electrocardiogram, a sign for imminent malignant arrhythmias. Circ 117:1890-1893, 2008.
Littmann L, Monroe MH, et al. The hyperkalemia Brugada sign. J Electrocardiol 40:53-59, 2007.
- RBBB
- RVH
- Old posterior MI
- WPW – type A
A very useful differential includes the 4 causes of a tall R wave in V1. A tall R wave here is defined as an R wave (positive deflection above the baseline) that is greater than the associated S wave (R/S >1). The four causes include RBBB, RVH, an old posterior MI, and Wolff-Parkinson-White, type A. Each of these has a clue to their diagnosis.
RBBB always has a prolonged QRS interval and often a wide terminal S wave in the lateral leads, in addition to a tall R wave in V1. Note that the tall R wave in V1 does not always take the form of “rabbit ears” or rR’ as is widely discussed.
Right ventricular hypertrophy (RVH) is associated with right axis deviation. Although the right ventricle is enlarged, this is usually not sufficient to prolong depolarization (eg cause a prolonged QRS interval).
Note the T-wave inversion in the anterior leads (V1-3) that is consistent with right ventricular strain. While the right-sided T wave inversion, an S1Q3T3 pattern, and the right axis deviation may be seen with acute pulmonary embolus, the tall R in V1 is a marker of chronic hypertrophy and will not be present in acute PE.
Tall R waves in V1-2 may be the equivalent of Q waves from the posterior wall following a prior transmural infarct. An old posterior MI is typically an extension of an inferior MI, thus the tall R wave in V1 will be associated with Q waves in the inferior leads (II, III, aVF).
Wolff-Parkinson-White syndrome can be divided into type A or B, with type A defined as having a tall R in V1. This cause of a tall R in V1 can be diagnosed by noticing other hallmarks of WPW, including a short PR interval and delta waves.
WPW, type A, is often misinterpreted as a RBBB by computer algorithms and novice EKG readers.
Remember this brief differential for tall R wave in V1 and the clues to correct diagnosis:
- RBBB — wide QRS complex
- RVH — right axis deviation
- Old posterior MI — Q’s in inferior leads (old inferior MI)
- WPW, type A — short PR, delta waves
Impressive T-wave inversion is a striking EKG finding that is associated with a limited differential well worth remembering. This finding is appropriately often interpreted as cardiac ischemia, and this possibility always needs to be ruled out while other possibilities are considered. Knowledge of this differential will allow emergency medicine providers to make a considered approach to evaluation.
- Subendocardial infarction/ischemia
- Vasospasm
- Takotsubo (stress) cardiomyopathy
- CNS effects (especially SAH)
- Apical hypertrophic cardiomyopathy
- Wellens’ warning (in V2-3)
- Memory T-waves (associated with paced rhythms)
48-year-old woman with migraine headache was treated with sumatriptan SQ. Within minutes she developed crushing chest pain.
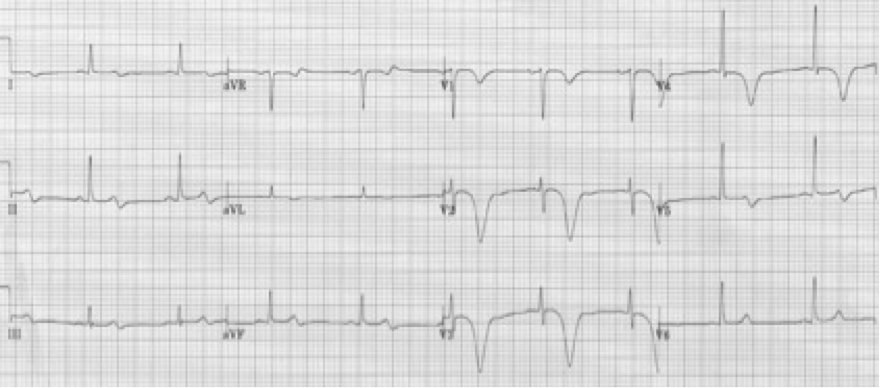
This example of deeply inverted T waves is due to vasospasm caused by the sumatriptan. Recall that sumatriptan activates vascular serotonin 5-HT1 receptors producing vasoconstriction, and should not be used in patients with a history of coronary disease or CVA. This patient’s EKG reverted to normal after treatment.
55-year-old presents with chest pain after an emotional argument with her daughter. She has no cardiac risk factors.

Takotsubo cardiomyopathy (stress cardiomyopathy) is a transient left ventricular dysfunction with characteristic wall motion abnormalities. It typically affects older women following an emotional or physical trigger. This disorder was first described in Japan in the 1990’s. The name is derived from the Japanese word for “octopus pot” which has the same shape as the LV on angiogram, best described as apical ballooning. It is believed that the pathogenesis relates to catecholamine excess and the brain-heart axis.
40-year-old man collapsed at home. He is lethargic on presentation, complaining of a headache. Neuro exam is limited but non-focal. His EKG on presentation…
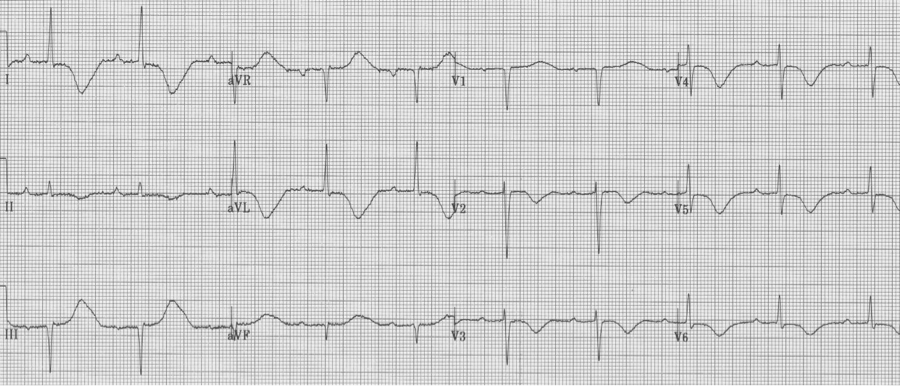
This EKG demonstrates classic changes seen with CNS events – diffuse and impressively deep T wave inversion. The inverted T waves are often described as asymmetric with an outward bulge of the ascending portion of the T wave, as can be seen here. CT scan revealed a large subarachnoid hemorrhage.
36-year-old Iraqi man presents with atypical chest pain and dizziness. He has no prior cardiac or respiratory history.
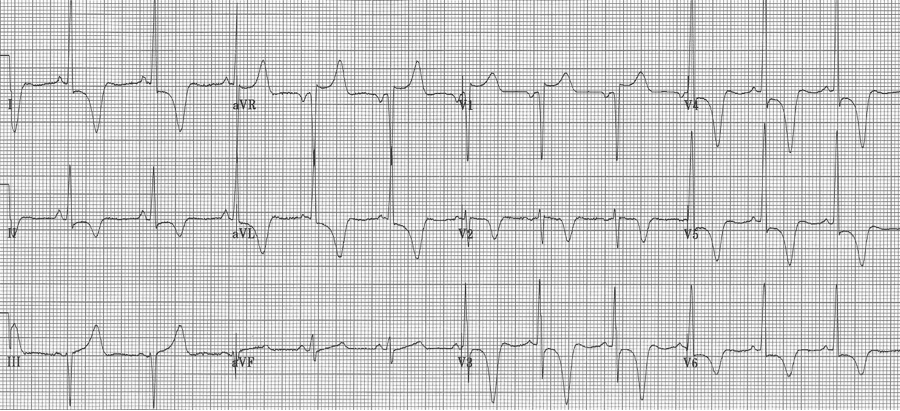
This striking EKG is typical of an unusual form of hypertrophic cardiomyopathy – apical hypertrophic cardiomyopathy, or Yamaguchi syndrome. This type of HCM is relatively common in the Japanese population, where it was first described, but occurs rarely in other populations (3% of all HCM in the US).
60-year-old woman experienced one hour of severe substernal chest pain earlier in the day. When her husband returned home that afternoon he insisted she come to the ER for evaluation. She had been pain free for 6 hours when the initial EKG was performed.
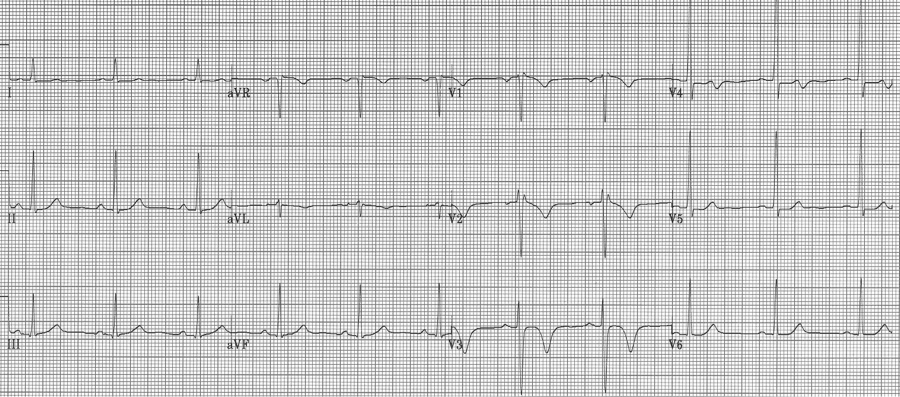
Wellens’ warning is predictive of critical stenosis of the proximal LAD artery. It is associated with either biphasic or deeply inverted T waves in V2-3 that occur during the pain-free interval following a significant episode of chest pain. In their original paper, Wellens described this finding in 18% of patients admitted for unstable angina and found 75% of these patients went on to have an anterior MI within weeks. These patients need aggressive medical management and urgent cardiac catheterization.
78-year-old woman is evaluated after several days of vomiting and diarrhea. PMH: atrial fibrillation, VVI pacemaker.
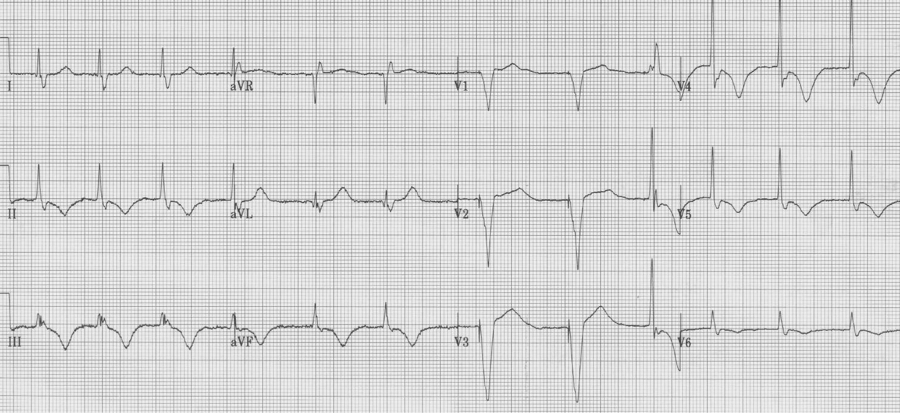
Diffuse deep T wave inversion can be seen following ventricular pacing. These “memory T waves” are thought to occur as a result of myocardial remodeling due altered paths of depolarization with paced rhythms. The length of post-pacing changes is proportional to the length of prior pacing. While this is a benign cause of T wave inversion, cardiac ischemia must be ruled out in those with risk factors. This elderly woman was usually 100% ventricular paced but had atrial fibrillation with a faster ventricular response after several days of vomiting and inability to take her medications. She was admitted for control of symptoms and ultimately ischemia was ruled out with negative cardiac enzymes.
References:
Pillarisetti J, Gupta K. Giant inverted T waves in the ED. J of Electrocard 43:40-42, 2010.
Templin C, et al. Clinical features and outcomes of Takotsubo (stress) cardiomyopathy. N Engl J Med 373:929-938,2015.
Perron AD, Brady WJ. Electrocardiographic manifestations of CNS events. Am J Emerg Med 18:715-20, 2000.
Yamaguchi H, et al. Hypertrophic nonobstructive cardiomyopathy with giant negative T waves (apical hypertrophy). Am J Cardiol 44:401-412, 1979.
Rhinehardt J, Brady WJ, Perrod AD, et al. Electrocardiographic manifestations of Wellens’ syndrome. Am J Emerg Med 20:638-43, 2002.
Kolb, JC. Cardiac memory – persistent T wave changes after ventricular pacing. J Emerg Med 23:191-197, 2002.
During sinus rhythm there is a limited differential of conditions that cause a prolonged QRS interval. These can be divided into one of the following categories:
Conduction – Poisons – Masqueraders.
Conduction
– RBBB
– LBBB
– Severe LVH
Poisons
– Hyperkalemia
– TCA toxicity (Na-channel toxicity)
Masqueraders
– Wolff-Parkinson-White syndrome
– Hypothermia
Remember to check all 12 leads on the EKG for the longest QRS complex as portions of some complexes may be isoelectric and will underestimate QRS duration.
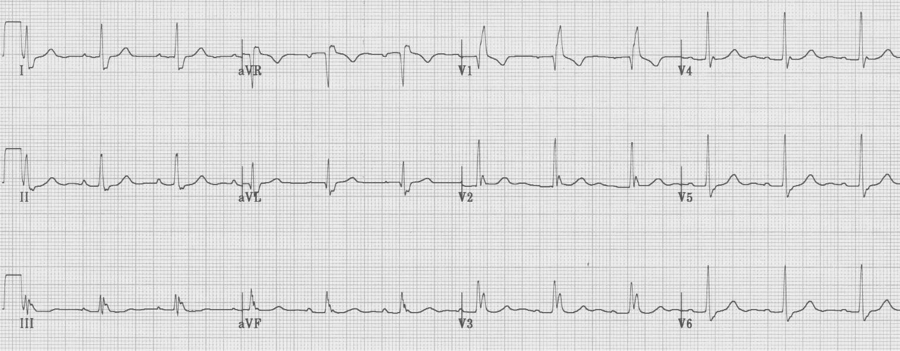
RBBB
– prolonged QRS (QRS ≥ 110msec)
– tall R in V1 (R/S > 1), not always rR’ (or “rabbit ears”)
– wide terminal S wave in lateral leads (I, aVL and V6)
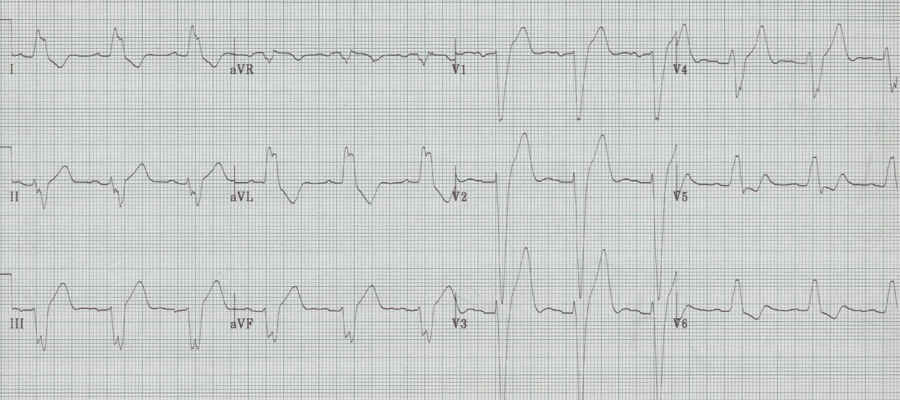
LBBB
– prolonged QRS, always > 120msec
– wide monophasic R wave in V6 (no septal Q waves)
– wide spread repolarization changes, including especially:
– T wave inversion laterally
– ST segment elevation V1-3
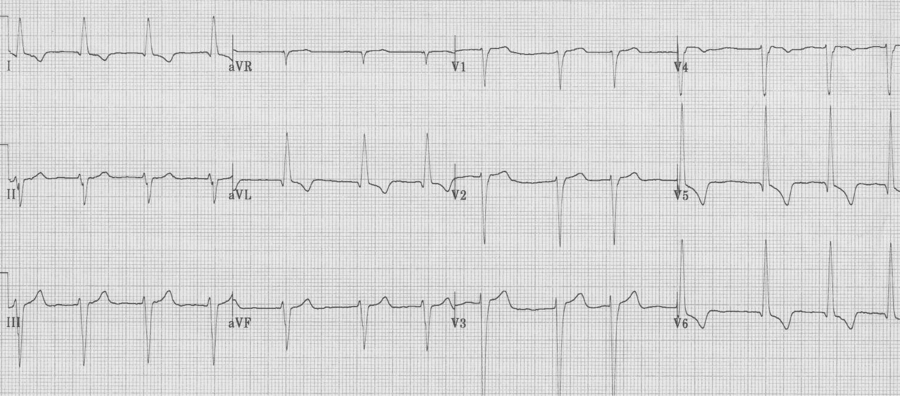
Severe LVH
– voltage requirement
– deepest S in V1-2 + tallest R in V5-6 > 35mm (and > 35 years old), OR R in aVL ≥ 12mm
– secondary changes accrue as LVH progresses
– “strain” pattern of T wave inversion in lateral leads
– left axis deviation
– poor R wave progression in right anterior leads
– ST segment elevation in V1-3
– widening of the QRS
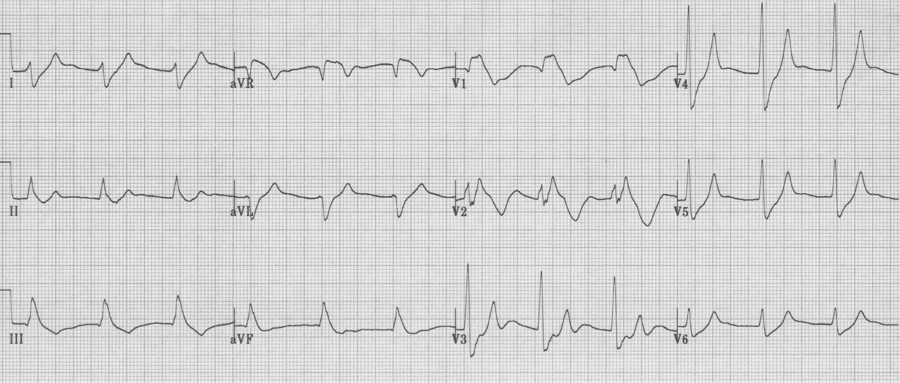
Hyperkalemia
– progressive changes include:
– tall peaked T waves
– progressive widening of the QRS complex
– diminution of the P wave (until it may disappear)
– while impossible to correlate specific changes with the level of K+, the changes will follow this progression:
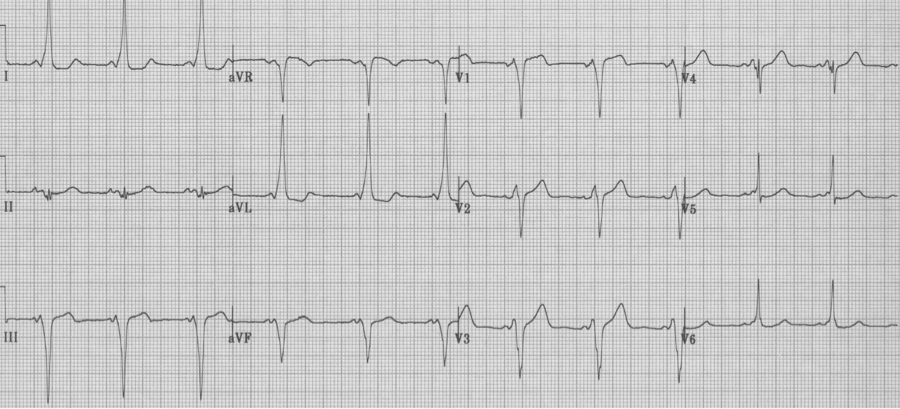
TCA toxicity (or any Na-channel blocking agent)
– relative tachycardia 2° anticholinergic effect
– prolonged QRS interval (of increasing severity – see following)
– prolonged QTc interval
– R in aVR > 3mm (representing rightward shift of terminal 40msec of QRS)
Wolff-Parkinson-White syndrome
– diagnostic criteria:
– short PR interval
– upsloping delta wave between P wave and QRS
– prolonged QRS (by the delta wave)
– Type B (as above) has a LBBB morphology appearance
– Type A is defined as having a tall R wave (R/S >1) in lead V1, and therefore a RBBB appearance (see below)
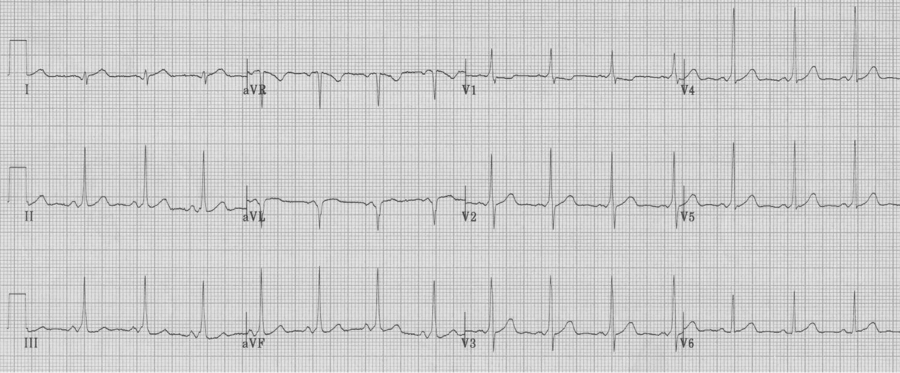
Wolff-Parkinson-White syndrome, Type A
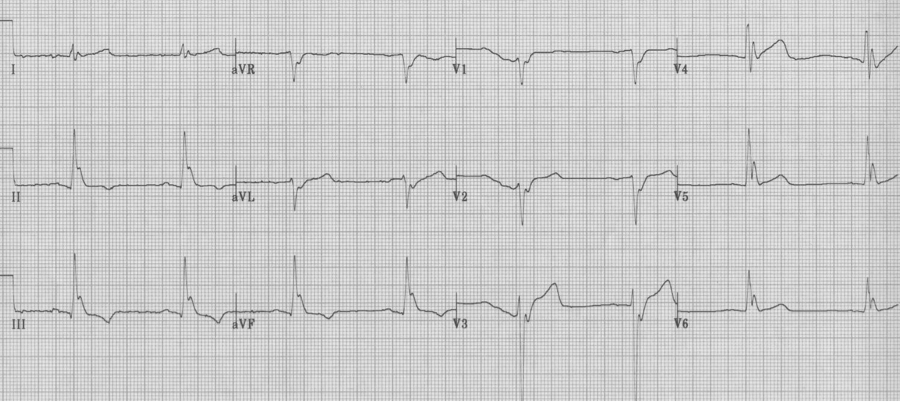
Hypothermia
– Osborne waves appear at the end of the QRS complex below 90° (32°C)
– Osborne waves become larger as the core temperature decreases
– Sinus becomes more bradycardic, often atrial fib appears
– Severe hypothermia can also be misinterpreted as a LBBB, or large Osborne waves can be mistaken for ST-segment elevation (as in the following tracing).
ST-segment elevation – not always a STEMI
1. STEMI
2. LBBB
3. Ventricular paced rhythm
4. Severe LVH
5. Early repolarization
6. Pericarditis
7. Ventricular aneurysm
Identifying a definite STEMI by EKG can be challenging. It requires knowledge of other common causes of ST-segment elevation as listed above. The expected repolarization changes of LBBB, ventricular paced rhythm, and severe LVH may include ST-elevation in the right chest leads (V1-3). Early benign repolarization is a common finding, especially in young people, and can be easily misinterpreted as ST-segment elevation of an acute infarct. Pericarditis can cause diffuse ST-segment elevation. Ventricular aneurysm, or a dyskinetic myocardium after a large transmural infarct, is a cause of persistent ST-segment elevation, typically associated with well-developed Q waves in the associated leads. Each of these causes of ST-segment elevation have typical presentations which make discerning the correct diagnosis easier.
STEMI
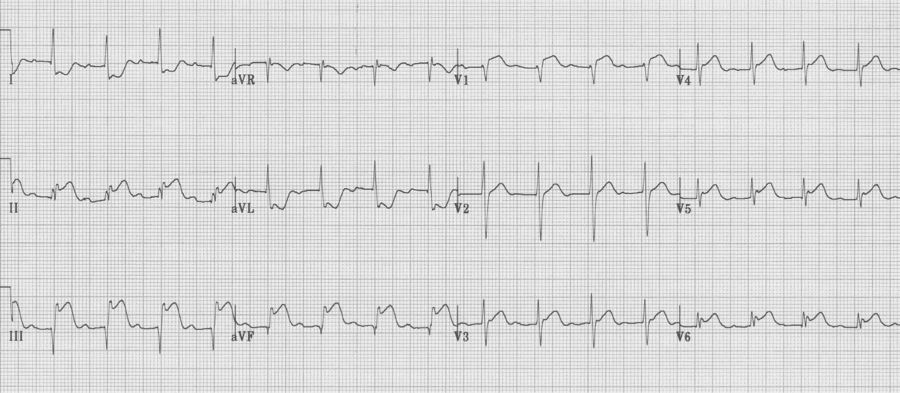
ST-elevation is the defining EKG change of an acute transmural myocardial infarct
– often associated with reciprocal changes (notice ST depression in I and aVL)
LBBB
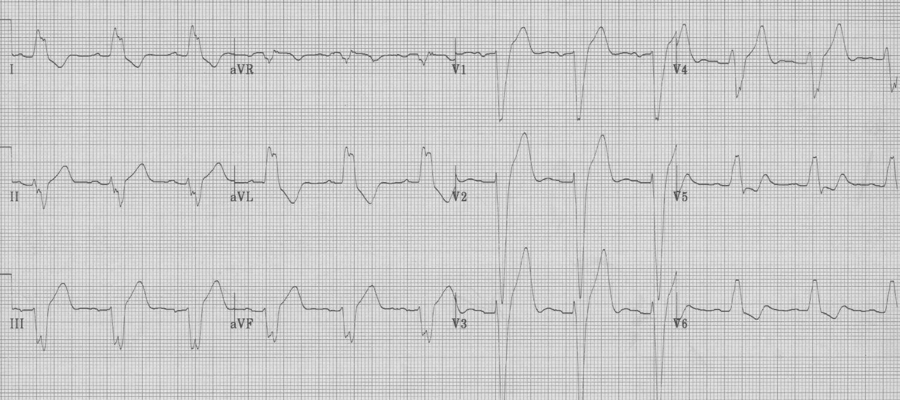
Expected repolarization changes occurring with a LBBB typically include ST-segment elevation in anterior chest leads (V1-3). Repolarization changes in LBBB should always be discordant to the QRS complex (oriented in the opposite direction) and may include ST-segment changes and exuberant T waves opposite the QRS direction.
Ventricular paced complexes
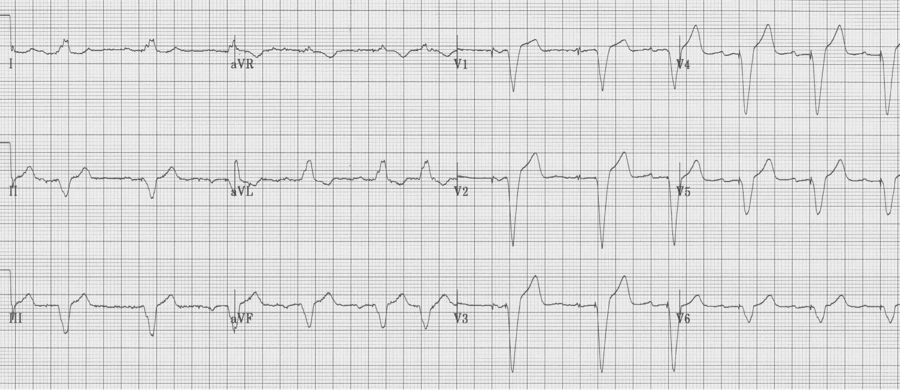
Ventricular paced complexes have LBBB-morphology because depolarization proceeds from the right ventricle where the pacer wire is inserted toward the left ventricle. This alternative method of ventricular depolarization is the cause of the abnormal repolarization with ST-segment elevation in the right anterior chest leads (V1-3), just as occurs with LBBB.
Severe LVH
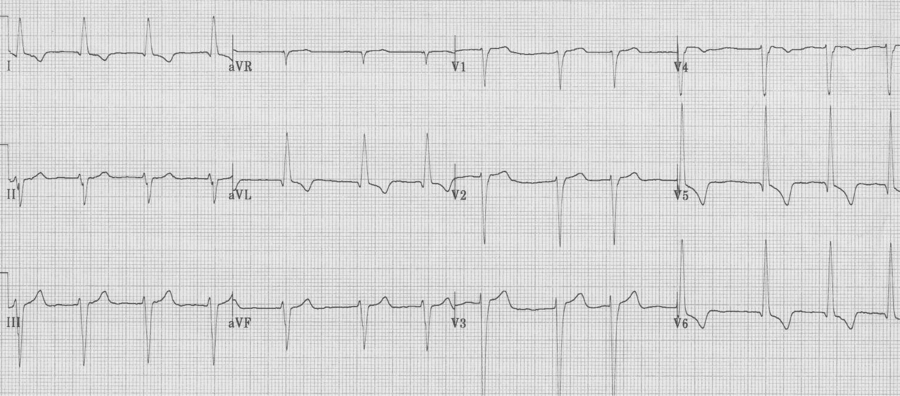
As left ventricular hypertrophy progresses several associated findings may develop, including “strain” pattern of lateral T wave inversion, slight widening of the QRS duration, left axis deviation, and poor R wave progression in the right anterior chest leads (V1-3) with ST-segment elevation in the same leads. These are among the most difficult EKGs to quickly and correctly interpret in a patient with chest pain.
Another severe LVH…
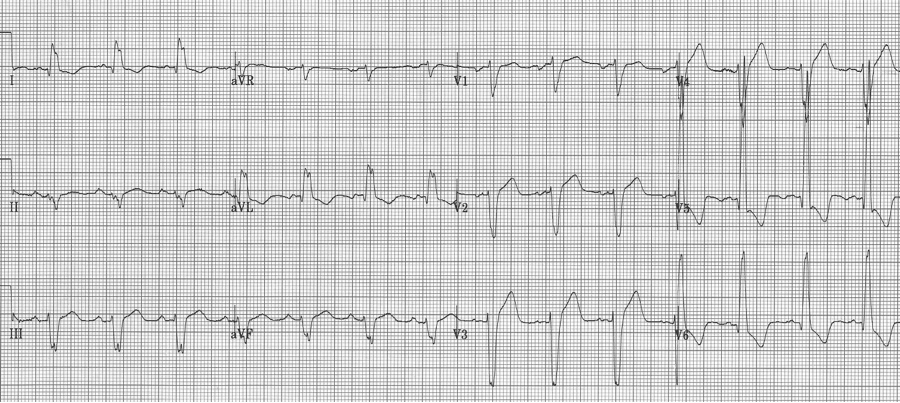
voltage criteria for LVH, strain pattern in lateral leads, wide QRS, left axis, and ST-elevation in anterior leads V1-2 – difficult to analyze without an old tracing
Benign early repolarization
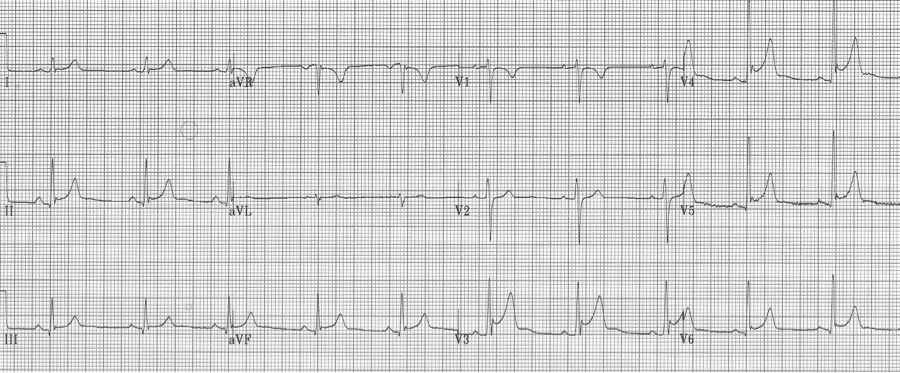
Early repolarization is characterized by several characteristic features including coved ST-segment elevation in the mid-anterior leads, a notch at the J point (often described as a “fishhook” appearance) also in the mid anterior leads, and early transition of R/S > 1 in the chest leads. This finding is relatively common in young men.
Pericarditis
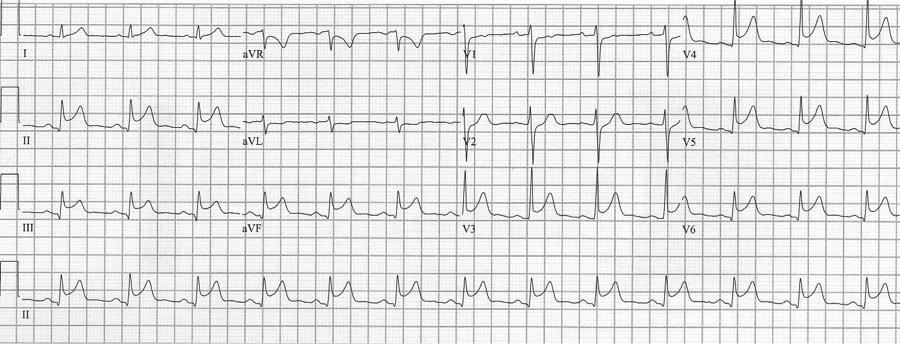
Pericarditis is a cause of diffuse ST-segment elevation. When pericarditis has clear ST-segment elevation in the inferior leads, the amount of ST elevation in lead II is greater than that in lead III (ST elevation II>III favors pericarditis). Determination of pericarditis is also benefited by clinical correlation and history.
Another case of acute pericarditis…
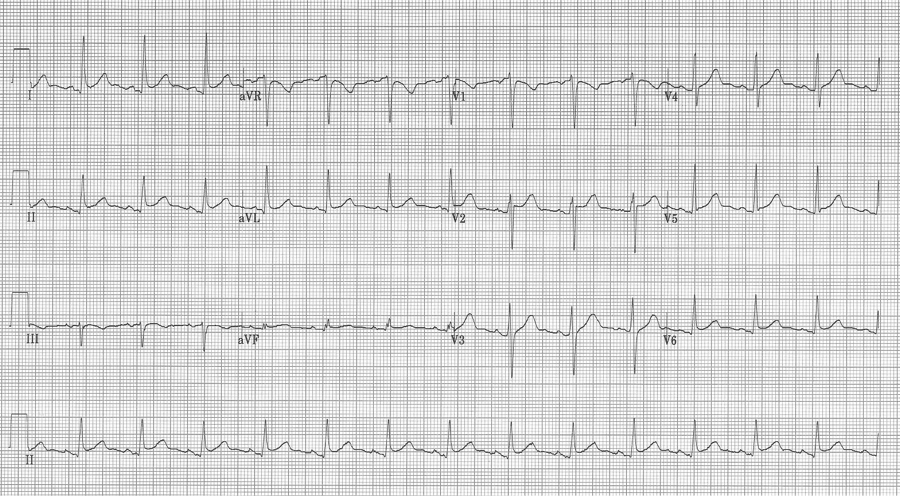
This EKG has subtle ST-segment elevation in multiple leads with no associated reciprocal changes, PR segment depression in lead II (and PR elevation in aVR), as well as Spodick’s sign in rhythm lead II (declining T-P segments).
Ventricular aneurysm
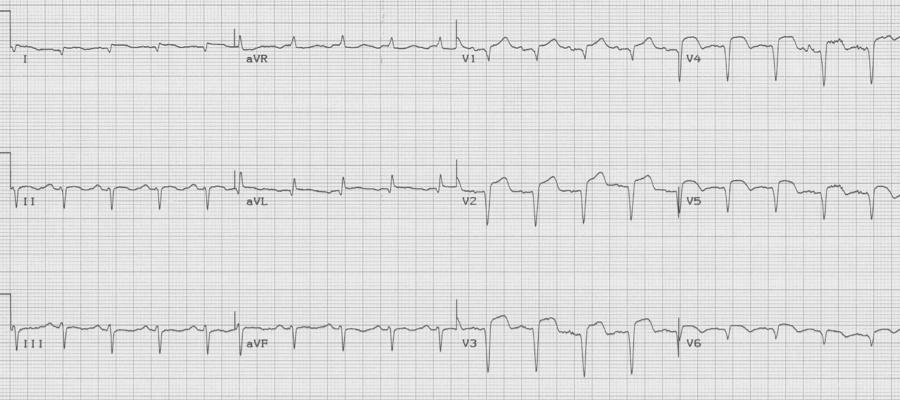
The EKG changes of ventricular aneurysm include persistent ST-segment elevation after a prior transmural infarct associated with Q waves of the old infarct. While ST-elevation following a transmural MI typically returns to baseline over the first 1-2 days, persistence of ST-elevation with well-developed Q waves may represent a ventricular aneurysm or significantly dyskinetic wall segment.
Spodick DH. Acute pericarditis: current concepts and practice. JAMA 289:1150-1153, 2003.
Wang K, Asinger RW, Marriott HJL. ST-segment elevation in conditions other than acute myocardial infarction. NEJM 349:2128-2135, 2003.
There are several important EKG patterns associated with ACS presentations that do not meet current STEMI guidelines for intervention, but do require aggressive evaluation and management, including urgent intervention.
- Critical left main artery occlusion
- Isolated posterior infarction
- Wellens’ warning of LAD lesion
- deWinter’s sign of LAD occlusion
Critical left main disease
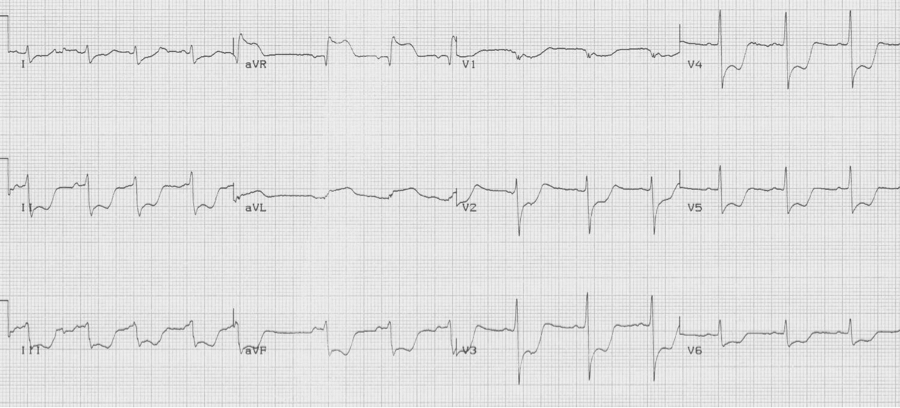
ST-segment depression in ≥ 8 leads AND ST-segment elevation in aVR is associated with critical stenosis of the left main coronary artery. These patients need urgent catheterization and possible CABG.
Isolated posterior MI
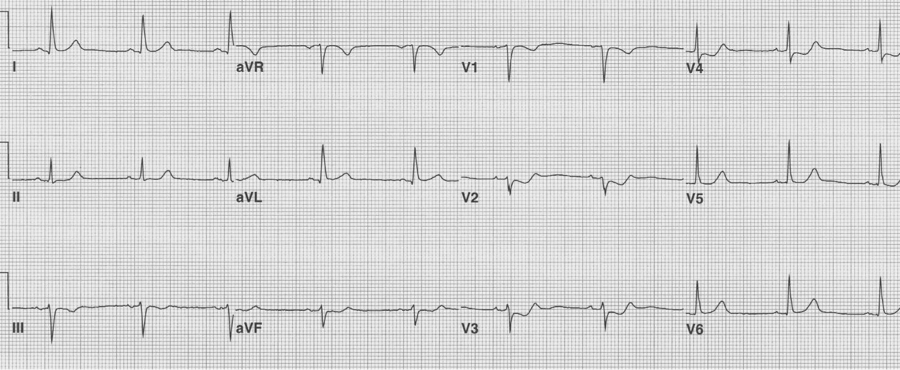
Most posterior wall infarcts occur as an extension of an inferior MI. Rarely, just the posterior wall may infarct, usually due to occlusion of the circumflex artery. The signs of isolated posterior MI include ST-segment depression in V1-3 and then development of R waves in V1-2 (the equivalent of Q waves).
Wellens’ syndrome
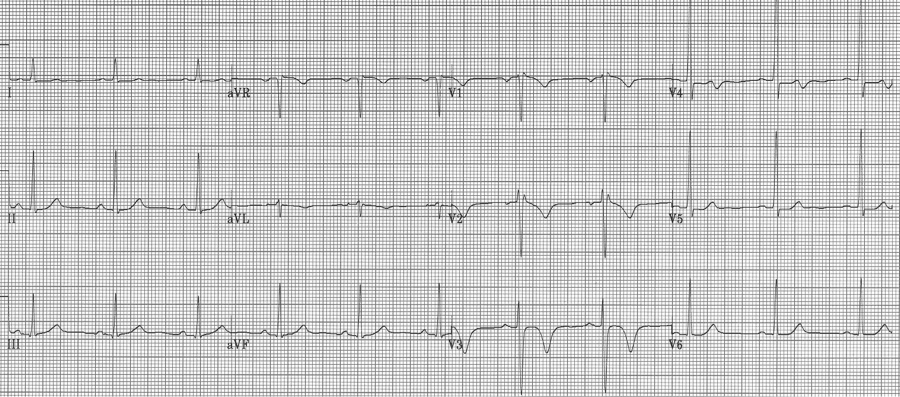
Critical stenosis of the proximal LAD artery is associated with either biphasic or inverted T waves in V2-3 occurring in the pain free interval following a significant episode of chest pain. In their original paper, Wellens described this finding in 18% of patients admitted for unstable angina and found 75% of these patients went on to have an anterior MI within weeks. These patients need aggressive medical management and urgent cardiac catheterization.
deWinter’s ST/T wave complex

Persistent precordial hyperacute T waves associated with upsloping ST-segment depression represent occlusion of the proximal LAD. This pattern was noted in 2% of anterior MIs. This pattern should be referred for immediate intervention.
References
Lawner BJ, Nable JV, Mattu A. Novel patterns of ischemia and STEMI equivalents. Cardiol Clin 30:591-599, 2012.
Rostoff P, et al. Electrocardiographic prediction of acute left main coronary artery occlusion. Am J Emerg Med 25:852-855, 2007.
Brady WJ, Erling B, Pollack M, et al. Electrocardiographic manifestations: acute posterior wall MI. J Emerg Med 20:391-401, 2001.
De Zwaan C, Bär FW, Wellens HJJ, et al. Characteristic electrocardiographic pattern indicating a critical stenosis high in the left anterior descending coronary artery in patients admitted because of impending myocardial infarction. Am Heart J 103:730–6, 1982.
Rhinehardt J, Brady WJ, Perrod AD, et al. Electrocardiographic manifestations of Wellens’ syndrome. Am J Emerg Med 20:638-43, 2002.
deWinter RJ, Verounden NJ, Wellens HJ, et al. A new ECG sign of proximal LAD occlusion. NEJM 359:2071-2073, 2008.
Verouden NJ, deWinter RJ, et al. Persistent precordial ”hyperacute” T-waves signify proximal LAD occlusion. Am Heart J 95:1701-1706, 2009.
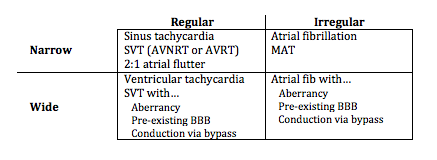
Diagnosing rapid tachycardia can be difficult, especially with rates ≥ 150/min. The first steps in diagnosis are to determine 1) whether the tachycardia is regular or irregular, 2) whether the QRS complex is narrow or wide, and 3) to look for any atrial activity (P waves, fibrillatory or flutter waves). By using this information with the diagnostic grid above it is often possible to determine the exact diagnosis, or at least limit the differential significantly.
Sinus tachycardia

– normal P waves before every QRS (P is upright in II, III, aVF and negative in aVR)
AVNRT or AVRT (commonly called SVT)

– regular tachycardia with no clear evidence of atrial activity
– P waves if present are conducted retrograde
– differentiating AVRNT and AVNT is limited, but occasional clues will be discussed
2:1 Atrial flutter

– flutter waves typically occur within the atria at approximately 300/min
– physiologic AV blocking (2:1) causes new-onset flutter to present at 150/min
– a rate of 150/min (135-150/min) should suggest 2:1 atrial flutter
– look for evidence of flutter waves in the inferior leads or lead V1
– above, the lead II flutter is exactly 150/hour, with 2 flutter waves for every QRS. While the QRS appears wide, the prolonged S wave is actually the appearance of the upstroke of the 2nd flutter wave superimposed behind the narrow QRS.
Atrial flutter with variable block after medication

Atrial fibrillation

– no discrete atrial activity (P waves); there may be irregular oscillations (f waves)
– ventricular response is irregularly irregular due to decrimental conduction
– ventricular response is typically rapid (150-180/min) prior to AV node blocking
– when rapid, atrial fib may appear regular and will need to be scrutinized carefully
Multifocal atrial tachycardia (MAT)

– the other irregularly irregular rhythm (consider when atrial fib Rx isn’t effective
– ≥3 atrial foci (P waves of differing morphology and PR intervals) with irregular R-R
Ventricular tachycardia

– ventricular tachycardia is a wide complex and regular tachycardia
– but consider the differential of WCT (wide-complex tachycardia)
Examples of supraventricular tachycardias with wide complex QRS

— a regular wide-complex tachycardia at 200/min

— after conversion to sinus rhythm – a pre-existing LBBB

— a regular wide-complex tachycardia

— after cardioversion to sinus, now a narrow complex with evidence of WPW
Examples of atrial fibrillation with wide complex QRS

— irregularly irregular, wide complex rhythm at 130/min – atrial fib with…

— after conversion, sinus rhythm with a LBBB morphology (pre-existing BBB)

— irregularly irregular, wide complex rhythm (note: varying QRS morphology and extremely rapid conduction (rate approaching 300/min)

— after cardioversion, sinus rhythm with WPW (a bypass tract)
Differentiating AVNRT vs. AVRT on the initial EKG
AV Nodal Re-entry Tachycardia (AVNRT) – re-entry paths are within the AV node
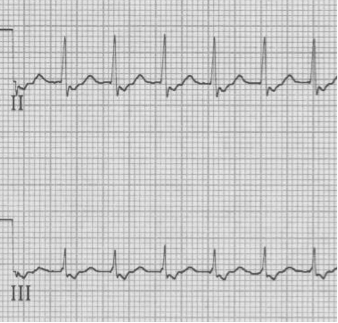
– pseudo-S waves in inferior leads are retrograde P waves close after QRS

– after cardioversion the pseudo-S waves disappear
AV re-entry tachycardia – re-entry involves a bypass tract (WPW)
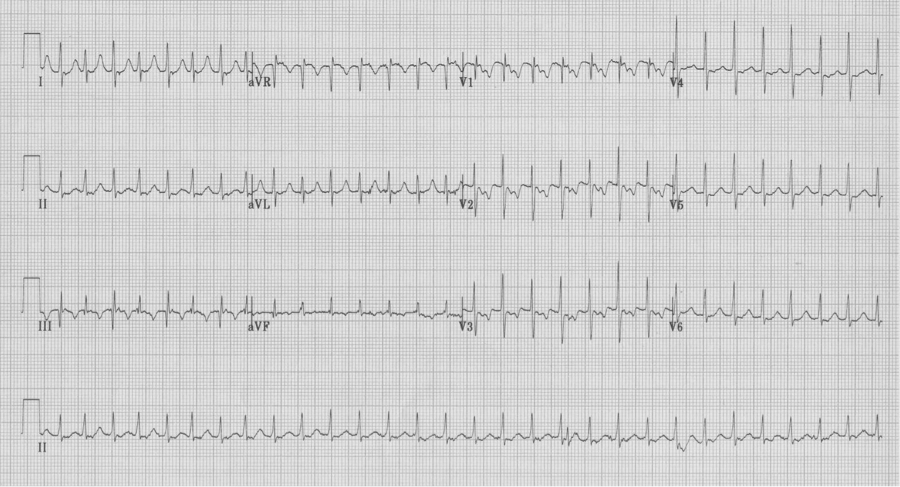
– notice the electrical alternans of the QRS in lead III
– also note the retrograde P in lead V1 with a longer R-P interval than in AVNRT
– these findings are not always present, but when present predict AVRT
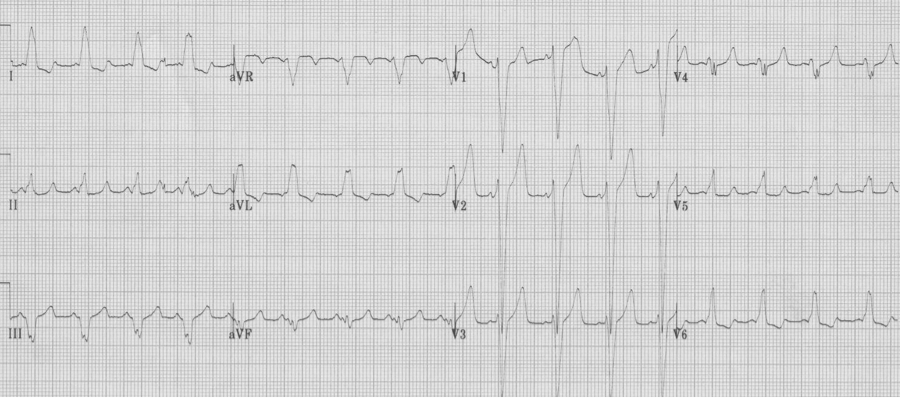
– after cardioversion, the EKG reveals WPW, type B, with short PR and delta waves
