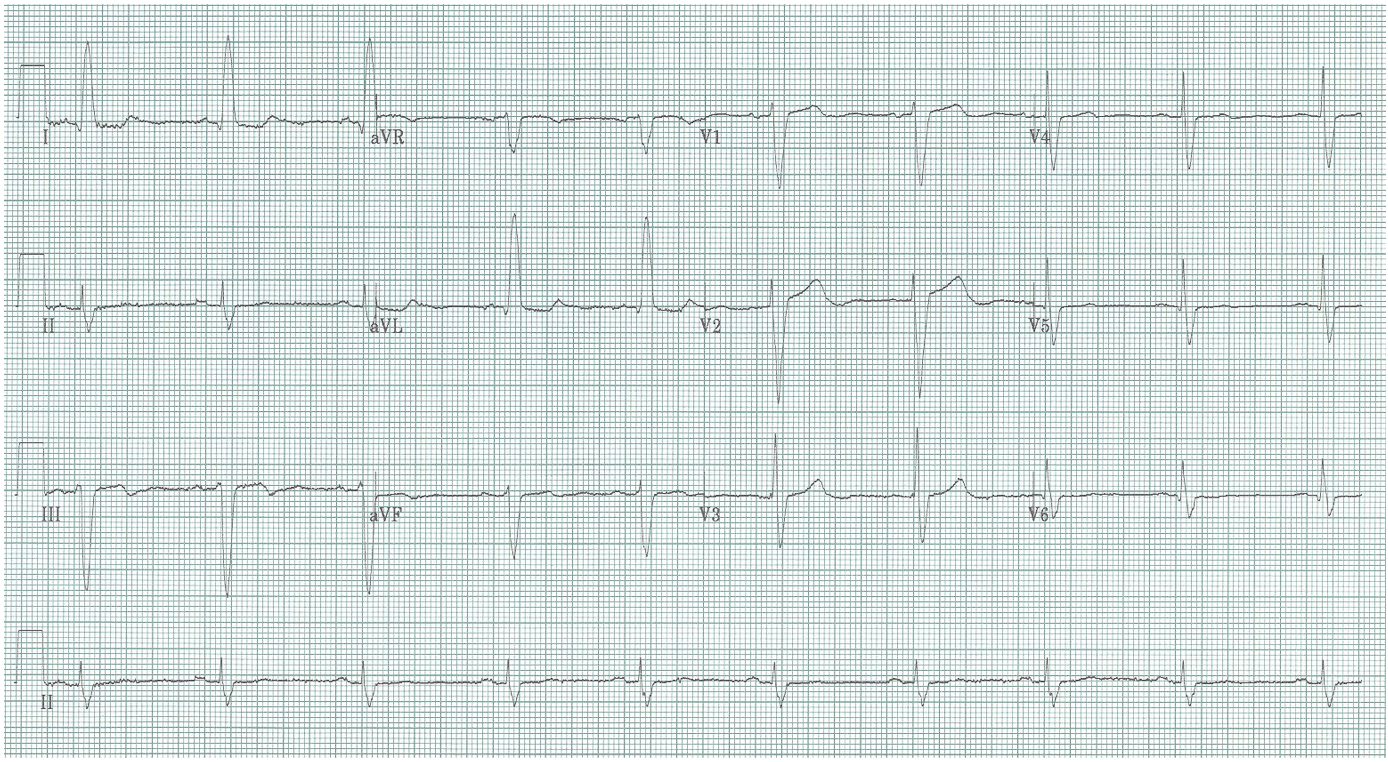
Is this a STEMI?
Is there another explanation for ST and T-wave changes seen
This EKG is important for emergency medicine providers. It is commonly seen in presentations of chest pain, and it is one of the most difficult of EKG patterns for ED physicians to interpret definitively.
Let’s return to a systematic review of the EKG…
Rate 60/minute
Rhythm Sinus rhythm with no ectopy
Axis Leftward axis at -30°
Intervals PR – 160msec, QRS – 110msec (slightly prolonged), QTc – normal
Chamber enlargement – LVH voltage because R≥12mm in aVL
Ischemia & Infarct – slight ST-elevation V1-3
While ST-segment elevation in the anterior leads may be the most concerning feature of this EKG on a cursory evaluation, there may be an alternative, and more appropriate, explanation.
In this EKG we have LVH by voltage criteria, plus several factors that suggest the diagnosis of severe LVH. These include:
1. ST-depression/T inversion in lateral leads – a “strain pattern”
2. left axis deviation
3. prolongation of the QRS complex (delayed depolarization due to increased size of the ventricle)
4. repolarization changes, including ST-elevation in anterior leads
As LVH becomes more severe, the changes on the EKG begin to resemble those of LBBB. Notice, however, that normal small Q waves (“septal Q waves”) remain in the lateral leads (I, aVL, V5-6). These Q waves signify that the LBBB is still functioning and provides depolarization of the septum!
Sometimes it takes some skill and confidence to NOT call a consultant!